
The Q1 Warning Did Not Disappear in Q2
In June, HillClimbers published Flat Budgets Don’t Mean Flat Staffing Levels after the second session of the 119th Congress opened with one of the sharper February-to-March staffing declines among recent Congresses.
At the time, the data raised an important question.
Was that simply an early-year adjustment?
The Q2 data gives us a much clearer answer.
The weakness persisted.
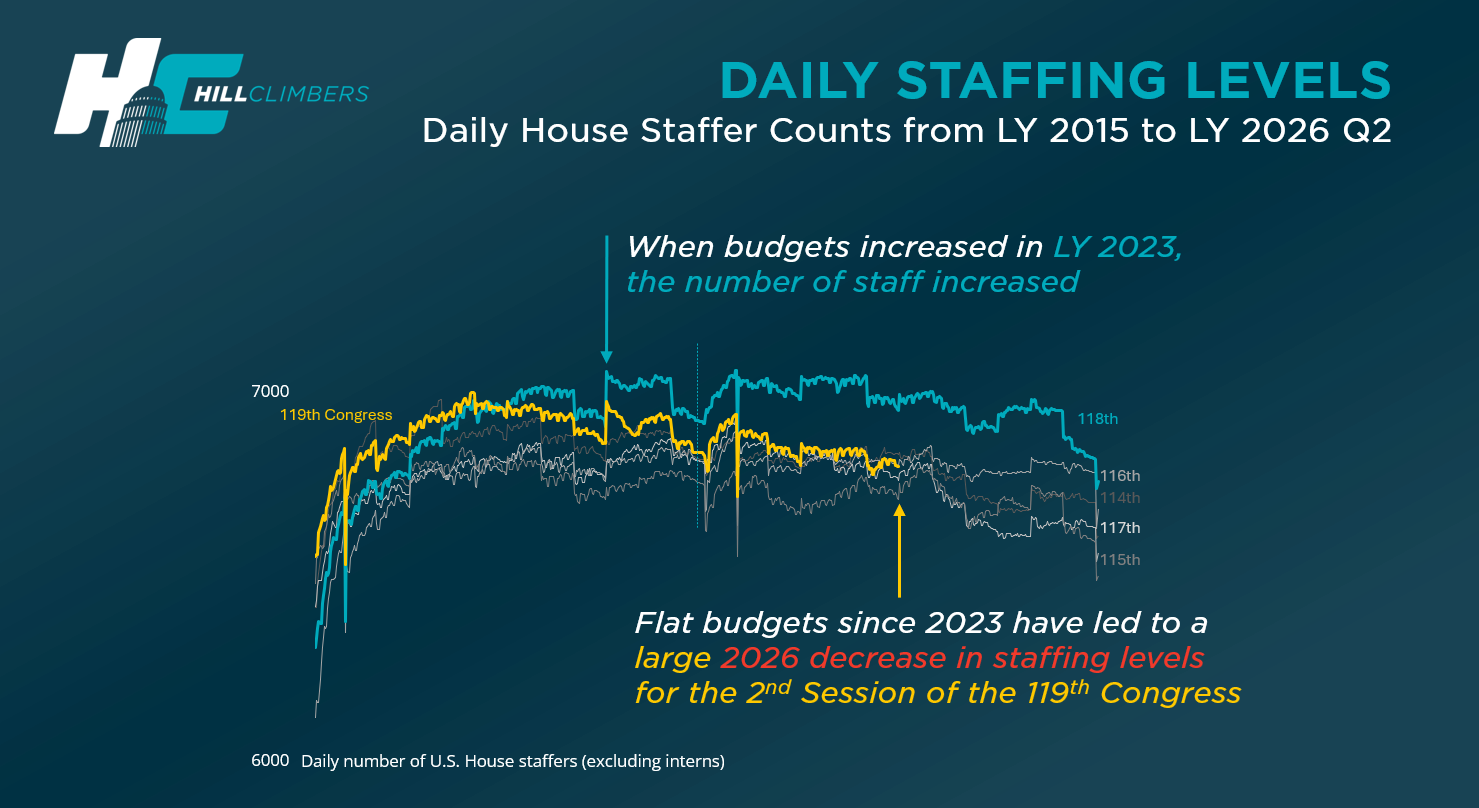
House Member offices averaged 6,827 non-intern staff per day during the first half of 2026, according to HillClimbers' updated person-level workforce data. That is 99 fewer than the comparable 2025 average and 238 fewer than the 7,065 average reached during the 2024 staffing rebound.
Readers can explore those workforce measures directly through HillClimbers' All House Staff - No Interns data, which separates the permanent workforce from the increasingly large paid intern population.
The early-year drop was the warning. Q2 shows the staffing weakness lasted.
This does not mean staffing fell continuously every day. Congressional employment moves as people leave, offices hire, Members reorganize teams, and vacancies open and close.
But the first-half average matters because it shows that the February-to-March weakness was not simply erased by later hiring.
The House enters the second half of 2026 with less permanent Member office staffing than it had in 2025, and materially less than it had during the 2024 rebound.
The House Staffing Rebound Is Unwinding
The 118th Congress Shows What Changed When Offices Had More Room
The most revealing line in the chart may be the 118th Congress.
HillClimbers previously showed in Congressional Staffing Levels Rise Or Fall Based On How Much Congress Invests In Itself that House staffing rose sharply after significant increases in Member office resources. A separate analysis of House office size found the same pattern at the office level: teams expanded as budget conditions improved, then began facing renewed pressure as that growth stopped.
That relationship is visible in the daily chart.
Staffing rose during the 118th Congress and remained above the recent congressional comparisons for much of the period.
The first-half average reached 7,065 non-intern staff per day in 2024, the highest comparable level since 2013.
Then the recovery reversed.
Average daily staffing fell to 6,926 in 2025 and 6,827 in 2026.
That is a 3.4% decline from the 2024 rebound.
The timing does not prove that budget levels caused every staffing change. Turnover, Member transitions, hiring decisions, office structure and title practices all matter.
But the broader pattern is consistent.
Staffing expanded when offices received more room.
Staffing weakened as that room narrowed.
The House showed that it could rebuild staff capacity. The harder question is whether it can sustain it.
Flat Budgets Do Not Produce Flat Outcomes
A "flat budget" can sound like nothing changed.
Inside a congressional office, that is rarely what it means.
A House Member office operates through the Member Representational Allowance, or MRA. As HillClimbers explains in How Congressional Staffing Works, the same operating allowance supports staff pay, supplies, official mail, district office rent, travel and other office needs. Members have flexibility in how they allocate those resources, but that flexibility does not create additional money.
The newest spending data shows what that tradeoff looks like.
HillClimbers found in House Offices Are Running Out of Things to Cut that average Q1 Member office spending fell from $486,924 in 2025 to $430,825 in 2026, an 11.5% decline.
Personnel spending fell 3.3%.
Non-personnel spending fell 30.3%.
That distinction matters.
Offices cut much more deeply outside payroll, which is consistent with an effort to preserve staff capacity where possible.
But personnel spending still fell.
There is a limit to how much an office can cut from mail, travel, supplies, rent and other operations before workforce decisions become part of the equation.
HillClimbers also identified compensation pressure earlier this year in Flat Budgets in 2026 Are Hitting House Staffers Even Harder. Since that article was published, HillClimbers has rebuilt House-wide compensation calculations around the newer person-level methodology, so the Q2 workforce analysis should be used for the latest aggregate compensation benchmarks. The broader salary-pressure finding remains relevant.
Staffing is one part of the budget story.
Pay is another.
Office structure is a third.
Fewer People Does Not Mean Fewer Office Functions
A Member office is not one generic workforce.
It is a collection of distinct functions.
HillClimbers' Member Office Roles framework organizes those functions across leadership, legislative, communications, administrative, district, constituent-service and non-permanent teams.
A Chief of Staff still has to manage the office and senior strategy. A Legislative Director still has to coordinate policy work. Legislative Assistants still have issue portfolios, research and legislative responsibilities.
The public-facing side does not disappear either. A Press Secretary or Communications Director still manages communications and media strategy. A Director of Operations still has to keep internal systems functioning. A Scheduler still has to manage the Member's time and logistics.
The same is true in the district.
A District Director still oversees district operations. Field Representatives still maintain local relationships and outreach. Constituent Services Representatives and Caseworkers still help people navigate federal agencies and services.
A staffing decline does not eliminate those functions.
It changes how offices cover them.
A vacancy can remain open longer.
Another employee can absorb part of the work.
Two responsibilities can be combined into one title.
Temporary staff can provide additional support.
The office can simply operate with less redundancy.
A vacant position does not erase the function. It redistributes the function.
That is why congressional capacity is staff capacity.
More Staff Are Also Carrying Multiple Roles
Headcount alone cannot show how the remaining work is distributed.
HillClimbers' July analysis, More House Staff Are Wearing Multiple Hats, found that the share of Member office staff carrying more than one classified role rose from 5.9% in 2010 to 8.2% in 2026, the highest level in the office-view series.
The timing makes the trend particularly relevant to this staffing story.
The multi-role share reached 7.8% in 2021, dipped to 7.7% in 2022 and 7.2% in 2023 as offices received significant budget relief, then rose again to 7.9% in 2024 and 8.2% in 2026.
That does not mean a combined title is inherently a problem.
Multiple-role staffing can be intentional and useful.
A Staff Assistant may naturally assist with correspondence, administrative work and front-office coverage. A Legislative Correspondent/Aide may span constituent correspondence and policy work. A Field Representative may combine outreach with casework-related responsibilities.
But an institution-wide increase can still be a capacity signal.
When more people are carrying more than one function while overall staffing is constrained, offices may have less room to specialize.
The 2022 and 2023 dip is especially notable because it moved in the opposite direction from the long-term trend during the period of greatest budget relief.
The data does not prove that added funding alone caused that dip.
It does suggest that budget relief may give offices more room to separate jobs that otherwise have to be combined.
The Permanent and Intern Workforces Are Moving in Different Directions
The chart deliberately excludes interns.
That distinction has become more important, not less.
HillClimbers' newest internship analysis, 2026 Is on Track for a Record Summer of Paid House Interns, found that paid House intern staffing first exceeded 2,000 people on a single day in summer 2025. By the end of June 2026, the House was already approaching that level again.
Spring 2026 had already produced the largest spring intern cohort in HillClimbers' daily House data.
So the two workforce lines are moving differently.
Permanent non-intern staffing remains below the 2024 rebound and far below its longer-term level.
Paid intern staffing is reaching record territory.
HillClimbers documented the broader shift in When Interns Become Infrastructure and in its analysis showing that House offices now employ roughly one intern for every five staffers during peak periods.
That does not establish that offices are replacing permanent workers with interns one-for-one.
The paid internship program has its own funding structure. Internships also serve educational and workforce-access purposes independent of permanent staffing decisions.
But the divergence changes the shape of congressional capacity.
A Paid Intern can provide meaningful operational support, but interns are temporary. They rotate out, require recruitment and onboarding, and do not provide the same continuity as permanent staff.
That distinction is also important for the career pipeline.
HillClimbers has shown in How Congress Quietly Replaced Part of Its Entry-Level Workforce that traditional permanent entry-level roles have declined while internships expanded.
Congress can create more opportunities to experience Capitol Hill while still maintaining fewer permanent positions through which people build long-term congressional careers.
Those two trends can exist at the same time.
Staffing Losses Can Also Become Experience Losses
Headcount is not the only thing at stake when permanent staffing contracts.
Experience matters too.
HillClimbers found in Institutional Knowledge in Congress Is Increasingly Held by Staff that average House staff experience increased from 2.3 years in 2018 to 3.6 years in 2025 while average Member tenure declined. That suggests a growing share of operational continuity may reside with congressional staff.
That makes retention particularly important.
HillClimbers' analysis of turnover in lower-paying congressional offices found that offices with the lowest average staff pay experienced the highest turnover in the comparison.
A staffing decline therefore does not have the same impact everywhere.
Losing an experienced employee who understands House procedure, agency relationships, constituent casework or an office's internal systems can create a larger capacity loss than the headcount change alone suggests.
That is one reason the HillClimbers Index looks beyond raw headcount and incorporates capacity, stability and structure.
A Member office can have the same number of staff as another office and still have a very different workforce profile.
The Updated Methodology Makes the Q2 Signal Stronger
This article also benefits from an important methodological improvement.
HillClimbers has rebuilt its House-wide staffing calculations around a person-level method.
The distinction matters because congressional titles often contain more than one role.
Someone serving as "Deputy Chief of Staff and Communications Director" legitimately belongs in both role categories when analyzing those jobs.
But when the question is how many people work in House Member offices, that employee is still one person.
The updated methodology therefore counts each person once in institution-wide workforce measures while continuing to count that staffer in each individual role they actually perform.
That is different from a role-view analysis, where the same employee may appear in several role categories.
The office-view method gives a cleaner answer to the question this chart is asking:
How many humans are working in House Member offices on a given day?
Readers can explore the current public measures through congressional staffing data, the All House Staff - No Interns page, and the underlying Congressional Dataset.
This is also why the Q2 figures are the better benchmark going forward.
The original June Insight correctly identified the early-year direction.
The updated Q2 data gives us both more time and a cleaner institution-wide measure.
Q2 Turns an Early Signal Into a First-Half Trend
The June article asked whether early 2026 was showing an unusually weak staffing pattern.
At that point, the evidence covered only the opening months.
Now the first half is complete.
Average daily non-intern staffing is down from 2025.
It is down 238 people from the 2024 rebound.
Q1 Member office spending is down.
Multiple-role staffing has reached a new high in the office-view series.
Paid internships are approaching record levels while the permanent workforce remains constrained.
Those measures do not all describe the same thing, and none by itself establishes a single cause.
Together, however, they describe a House workforce operating with less permanent headcount than it had during the recent funding-supported rebound and increasingly using other forms of flexibility to cover office functions.
That is a stronger finding than the early Q1 signal.
The House did rebuild some staffing capacity.
The first half of 2026 shows that it has not fully preserved that recovery.
Q2 is still a checkpoint, not the final 2026 result. Hiring, departures, elections and office reorganizations during the second half can change the full-year picture.
But the direction is now clearer than it was in March.
The next question is whether Q3 shows stabilization or another step down.
FAQ
Is House staffing still declining in 2026?
The Q2 data shows that the weakness identified earlier in 2026 persisted through the first half of the year. House Member offices averaged 6,827 non-intern staff per day through June, below both the comparable 2025 level and the 2024 rebound.
How many permanent House Member office staff are there in 2026?
House Member offices averaged 6,827 staff per day excluding interns at the 2026 Q2 checkpoint. HillClimbers separately counted 7,654 distinct non-intern staff who worked during the first half of Legislative Year 2026.
How much has House staffing fallen since 2024?
Average first-half staffing fell from 7,065 non-intern staff per day in 2024 to 6,827 in 2026. That is 238 fewer average daily staff, or approximately 3.4%.
Why does HillClimbers connect the staffing decline to flat budgets?
The connection is based on several overlapping patterns. Staffing expanded after significant Member office budget increases, then weakened as budget growth stopped. Q1 2026 office spending also fell 11.5%, including a 3.3% decline in personnel spending. That timing is consistent with budget pressure affecting staffing capacity, but it does not prove budgets caused every individual hiring or departure decision.
Why does this staffing analysis exclude interns?
Paid interns have become a large and increasingly seasonal workforce group. Excluding interns provides a clearer view of the permanent staff base responsible for ongoing legislative, communications, administrative, district, leadership and constituent-service work. Readers can explore the separate Paid Intern data and HillClimbers' latest intern staffing analysis.
Are interns replacing permanent House staff?
The data does not establish direct replacement. Paid intern staffing has expanded while permanent non-intern staffing and several traditional entry-level roles have declined, but that does not show that particular permanent positions were eliminated specifically to hire interns.
Are more House staff carrying multiple roles?
Yes. HillClimbers' office-view analysis found that 8.2% of Member office staff carried multiple classified roles in 2026, up from 5.9% in 2010 and the highest share in that series. Multiple-role staffing can be intentional and useful, but sustained growth may also indicate less room for specialization.
How does HillClimbers count someone who performs two jobs?
For institution-wide headcount, the employee counts once. For role-level analysis, the employee can appear in each role the title clearly reflects. That allows HillClimbers to count people accurately without losing information about how congressional work is actually distributed.
Suggested Reading
- Flat Budgets Don’t Mean Flat Staffing Levels
- The House Is Running With 1,020 Fewer Staff Than It Did in 2010
- Congressional Staffing Levels Rise Or Fall Based On How Much Congress Invests In Itself
- House Offices Are Running Out of Things to Cut
- More House Staff Are Wearing Multiple Hats
- How Big Is a Congressional Office Team and Why It’s Shrinking Again
- 2026 Is on Track for a Record Summer of Paid House Interns
- When Interns Become Infrastructure
- Institutional Knowledge in Congress Is Increasingly Held by Staff
- Low-Paying Congressional Offices Experience the Highest Staff Turnover
Explore Related HillClimbers Tools
- Explore All House Staff - No Interns
- Explore congressional staffing data
- Learn how congressional staffing works
- Explore Member Office Roles
- Explore the Congressional Dataset
- Explore the HillClimbers Index
- View current congressional jobs